Safety. Security. Longevity.
Aging America
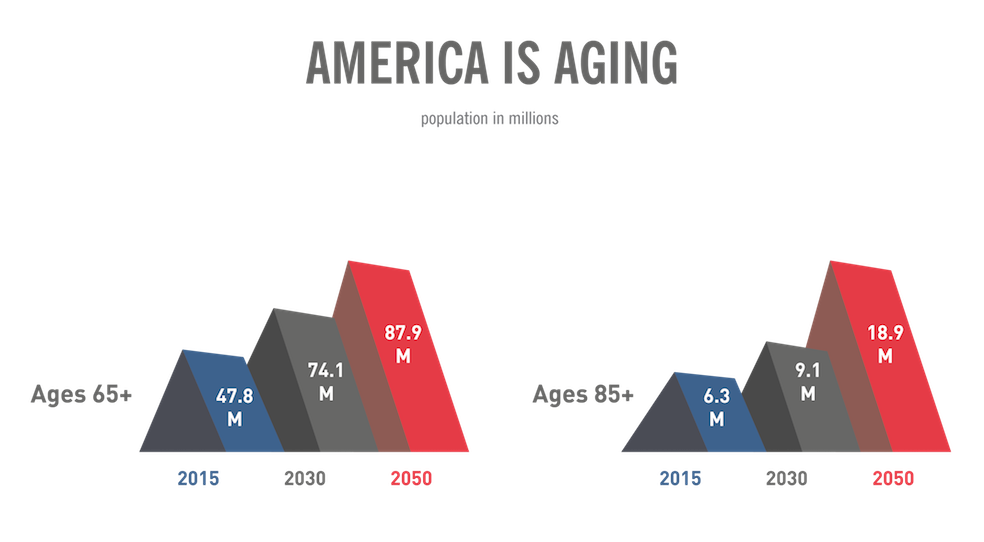
America is aging. So much so, that by 2035 one-third of U.S. households will be headed by someone 65 or older, and 16 million households by someone 80 or older.
Aging America: In the U.S. the population age 65 and older numbered 54.1 million in 2019 (the most recent year for which data are available). They represented 16% of the population, more than one in every seven Americans. The number of older Americans has increased by 14.4 million (or 36%) since 2009, compared to an increase of 3% for the under-65 population.

Your next adventure in life is all about Freedom and independence …and it starts at your front door!

Between 2009 and 2019, the number of Americans age 45-64 (who will reach age 65 over the next two decades) increased by 4% from 80.3 million to 83.3 million. The number of Americans age 60 and older increased by 34% from 55.7 million to 74.6 million.
In 2019, 30 million women and 24.1 million men were age 65 and older. That’s 125 women for every 100 men. At age 85 and older, this ratio increased to 178 women for every 100 men.
In 2019, 3.8 million persons celebrated their 65th birthdays. Census Bureau population estimates showed an annual net increase between 2018 and 2019 of 1.7 million people age 65 and over.

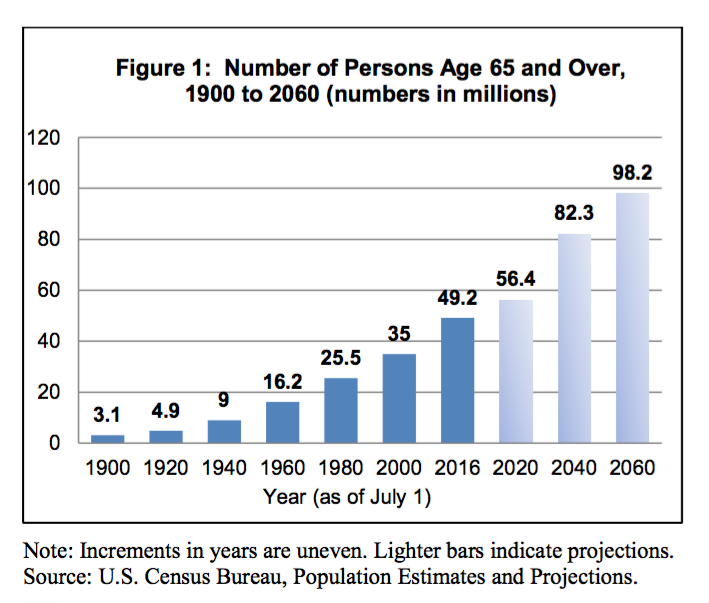
Since 1900, the percentage of Americans age 65 and over has more than tripled (from 4.1% in 1900 to 15.2% in 2016), and the number has increased over fifteen times (from 3.1 million to 49.2 million). The older population itself is increasingly older. In 2016, the 65-74 age group (28.6 million) was more than 13 times larger than in 1900 (2,186,767); the 75-84 group (14.2 million) was more than 18 times larger (771,369), and the 85+ group (6.4 million) was 52 times larger (122,362).
Between 1980 and 2019, the centenarian population experienced a larger percentage increase than did the total population. There were 100,322 persons age 100 and older in 2019—more than triple the 1980 figure of 32,194.
Future Growth
The older population is expected to continue to grow significantly in the future. Growth slowed somewhat during the 1990s because of the relatively small number of babies born during the Great Depression of the 1930s. But the older population is beginning to burgeon again as more than two-fifths (41%) of the “baby boom” generation is now age 65 and older.
The population age 65 and older increased from 39.6 million in 2009 to 54.1 million in 2019 (a 36% increase) and is projected to reach 94.7 million in 2060. By 2040, there will be about 80.8 million older persons, more than twice as many as in 2000.
The 85 and older population is projected to more than double from 6.6 million in 2019 to 14.4 million in 2040 (a 118% increase).
Taken from A Profile of Older Americans: 2020 developed by the Administration on Aging (AoA), Administration for Community Living, U.S. Department of Health and Human Services. AoA serves as an advocate for older adults within the federal government and is working to encourage and coordinate a responsive system of family and community based services throughout the nation. AoA helps states develop comprehensive service systems which are administered by 56 State Units on Aging, 629 Area Agencies on Aging, 263 Tribal organizations, and 1 Native Hawaiian organization.
Sources: U.S. Census Bureau, Population Division, Annual Estimates of the Resident Population for Selected Age Groups by Sex for the United States, States, Counties, and Puerto Rico Commonwealth and Municipios: April 1, 2010 to July 1, 2016. Release Date: June 2017; Table 1. Intercensal Estimates of the Resident Population by Sex and Age for the United States: April 1, 2000 to July 1, 2010. Release Date: September 2011; Annual Estimates of the Resident Population by Single Year of Age and Sex for the United States, States, Counties, and Puerto Rico Commonwealth and Municipios: April 1, 2010 to July 1, 2016. Release Date: June 2017; 2010 Census Special Reports, Centenarians: 2010, C2010SR-03, 2012; Hobbs, Frank and Nicole Stoops, Census 2000 Special Reports, Series CENSR-4, Demographic Trends in the 20th Century, Table 5. Population by Age and Sex for the United States: 1900 to 2000, Part A; National Center for Health Statistics, Kochanek KD, Murphy SL, Xu JQ, Arias E. Mortality in the United States, 2016. NCHS data brief, no 293. Hyattsville, MD: December 2017; and National Research Council, Crimmins EM, Preston SH, Cohen B, editors. Explaining Divergent Levels of Longevity in High-Income Countries. Panel on Understanding Divergent Trends in Longevity in High-Income Countries, 2011.
Become an Advisor
Comprehensive Home Safety Assessment
